Generative Pages deliver a working page in minutes. The best part: you can customize the code — e. g. D3 charts, dark mode, better filters, and Dataverse details (lookup/optionset labels). Here's my personal journey from the initial prompt to the final, polished version through coding.
My original prompt
This is how I generated the first version.
Original prompt (for reference)
Create a Generative page that reads from my Dataverse tables br_expenses, br_income, and br_expensecategories and shows a simple budget dashboard with:

Assume columns (map to existing if different):

br_expenses: br_expensesid (PK), br_date (Date Only), br_amount (Currency), br_notes (Text), _br_category_value (Lookup to br_expensecategories)

br_income: br_incomeid (PK), br_date (Date Only), br_amount (Currency), br_source (Text), br_notes (Text)

br_expensecategories: br_expensecategoriesid (PK), br_name (Text)

Top filters (horizontal):

Year dropdown (distinct years from both br_expenses.br_date and br_income.br_date)

Month dropdown (1–12, cascades from Year)

Defaults = current Year and Month; a "Clear filters" button resets both.

Use Dataverse Web API date functions in $filter: Microsoft.Dynamics.CRM.Year(field) and Microsoft.Dynamics.CRM.Month(field) (not year()/month()).

Visuals row:

Pie chart: two slices → "Income" vs "Expenses".

Values: sum(br_income.br_amount) and sum(br_expenses.br_amount) within the selected Year/Month.

Bar chart: Top Expenses (largest amounts).

Axis: category name from $expand of the lookup ($expand=br_category($select=br_name)), or notes if category is empty.

Values: sum of br_expenses.br_amount.

Show Top 10.

Bar chart: Top Incomes (highest amounts).

Axis: br_source (or notes if preferred).

Values: sum of br_income.br_amount.

Show Top 10.

Records section (bottom):

A tabbed grid with Expenses and Income tabs.

Each grid shows: Date, Amount, Category/Source, Notes.

Sorting by Date desc; search box to filter Notes/Source/Category.

Interactions (non-destructive):

Clicking the pie "Income" slice switches to the Income tab; clicking "Expenses" switches to Expenses.

Clicking a bar in Top Expenses sets a selectedCategory UI filter (do not overwrite fetched arrays) and scrolls to the Expenses grid prefiltered to that category.

Clicking a bar in Top Incomes sets a selectedSource UI filter and scrolls to the Income grid prefiltered to that source.

Show a small chip like "Filter: {Category/Source} ×" near the grids to clear that selection.

Data loading specifics:

Build $filter for each table like:
filter = [year ? "Microsoft.Dynamics.CRM.Year(br_date) eq {year}" : "", month ? "Microsoft.Dynamics.CRM.Month(br_date) eq {month}" : ""].filter(Boolean).join(" and ")

Expenses query: $select=br_expensesid,br_date,br_amount,br_notes,_br_category_value and
$expand=br_category($select=br_name) to get the category text.

Income query: $select=br_incomeid,br_date,br_amount,br_source,br_notes.

Sum using Number(...) to avoid string math.

UX details:

Currency formatting via Intl.NumberFormat using environment locale.

Empty states when no data matches the filters.

Responsive layout; avoid fixed SVG sizes (use viewBox).

Do not rely on @OData.Community.Display.V1.FormattedValue for lookup names—use $expand as above.
Why Generative Pages – and still code?
A short description gives you a model-driven page that turns out better or worse depending on how structured your prompt was. That's great for early prototypes, but if you want it to really work, a bit of code lets you build the page exactly the way you want it.
Example scenario (Dataverse)
- br_expenses:
br_expensename,br_amount,br_date,br_notes,_br_category_value - br_income:
br_incomename,br_amount,br_date,br_notes,br_source(Optionset) - br_expensecategories
From prompt to result – the journey in 4 steps
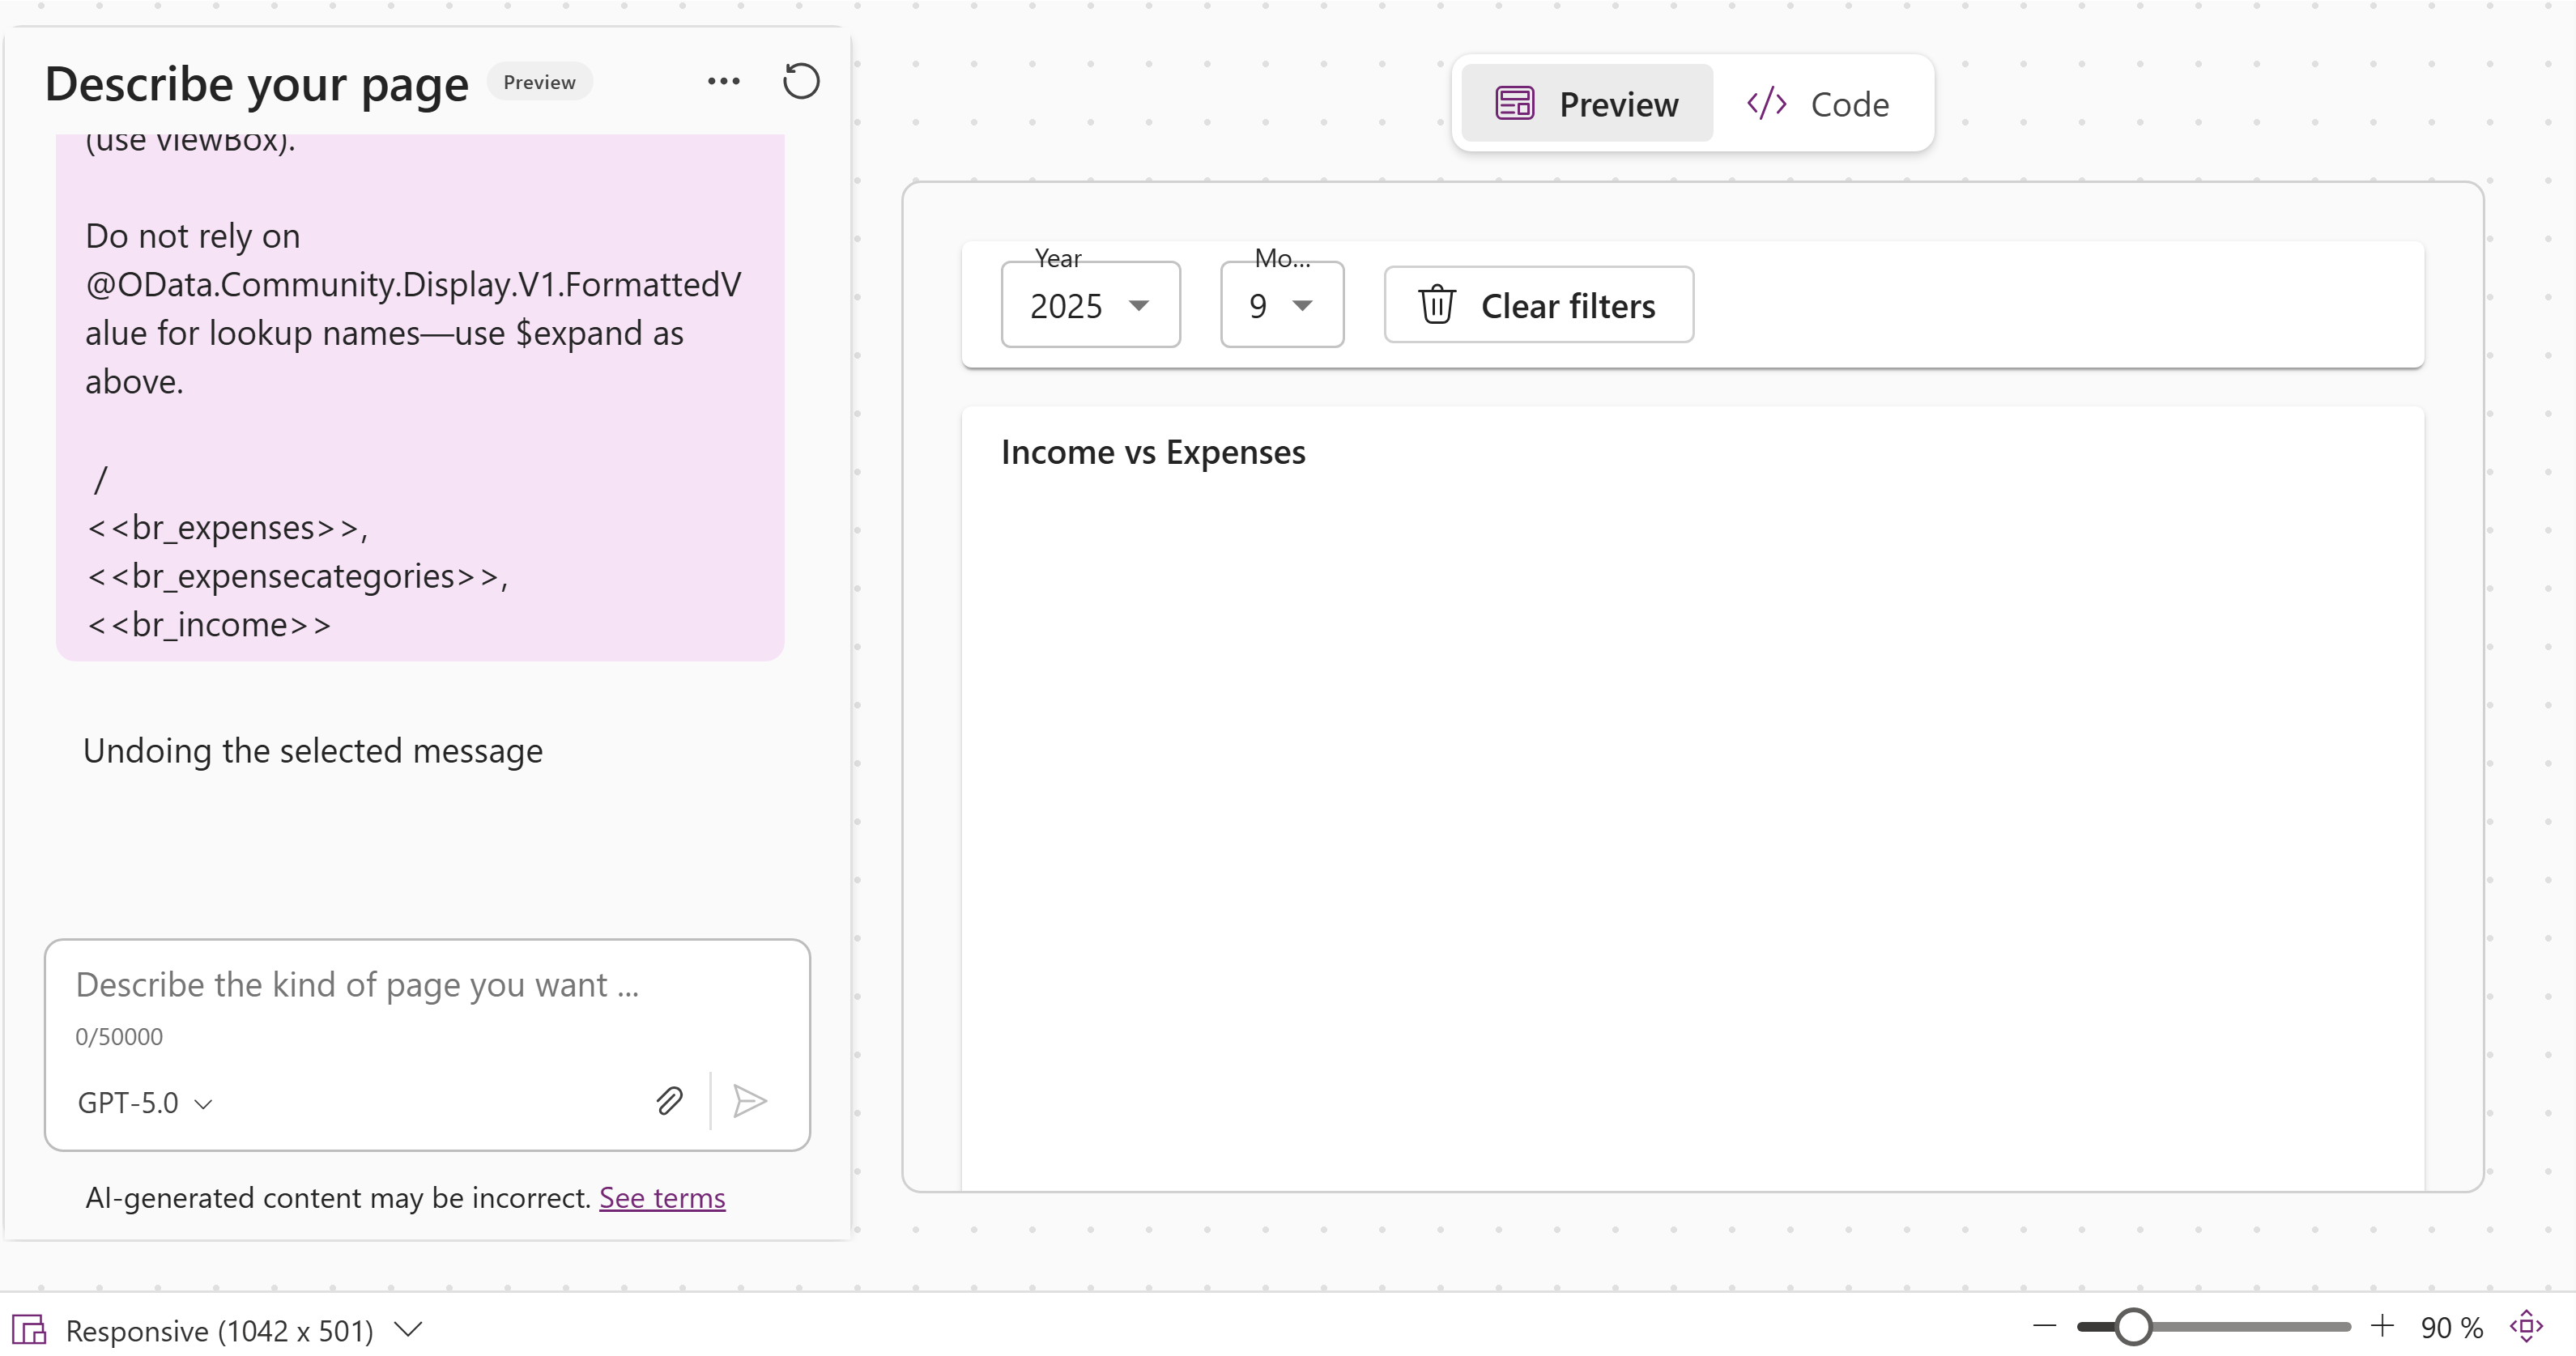
1) Prompt & first generated page
I describe the page in broad strokes (data sources, three visuals, a table) and let the first version generate. A good starting point, but still rough and not really polished.
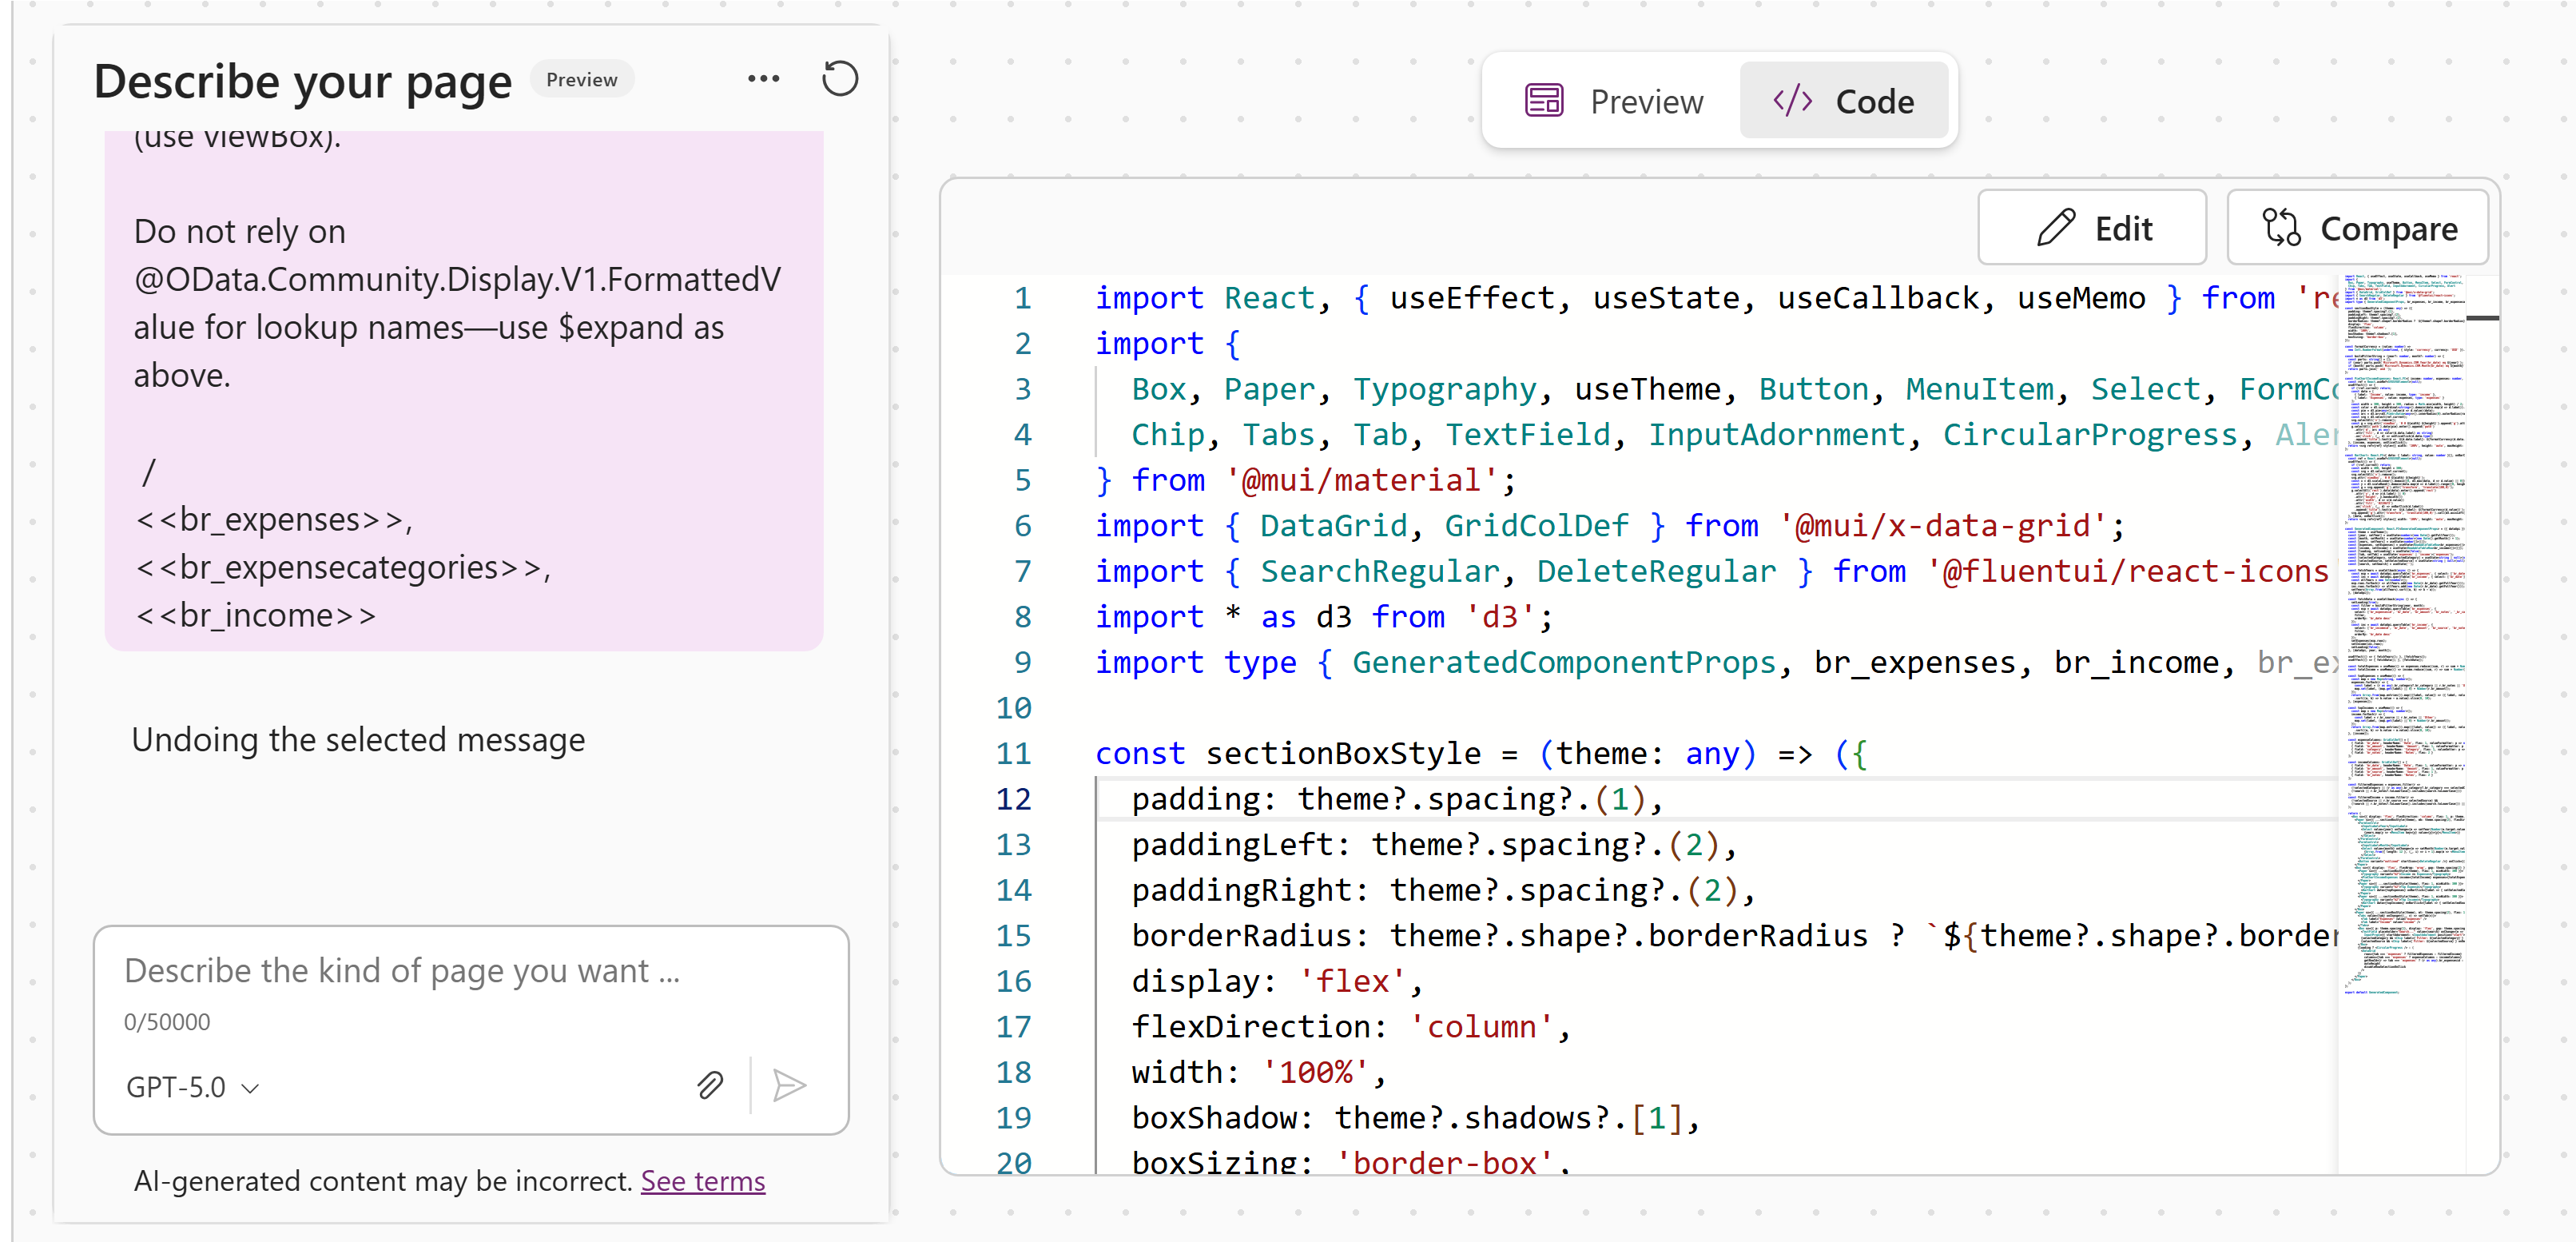
2) Opening the code view
This is where it gets interesting: I switch to the code view to adjust charts, filters, and the grid layout. Here I can either edit the whole code directly in the editor, or copy it into my preferred development tool — in my case, Visual Studio Code.
3) First round of code additions
I then extended the code, focusing on: a donut chart for Income vs. Expenses (with totals in the center), compact bars for Top Expenses/Incomes, and correctly formatted values.
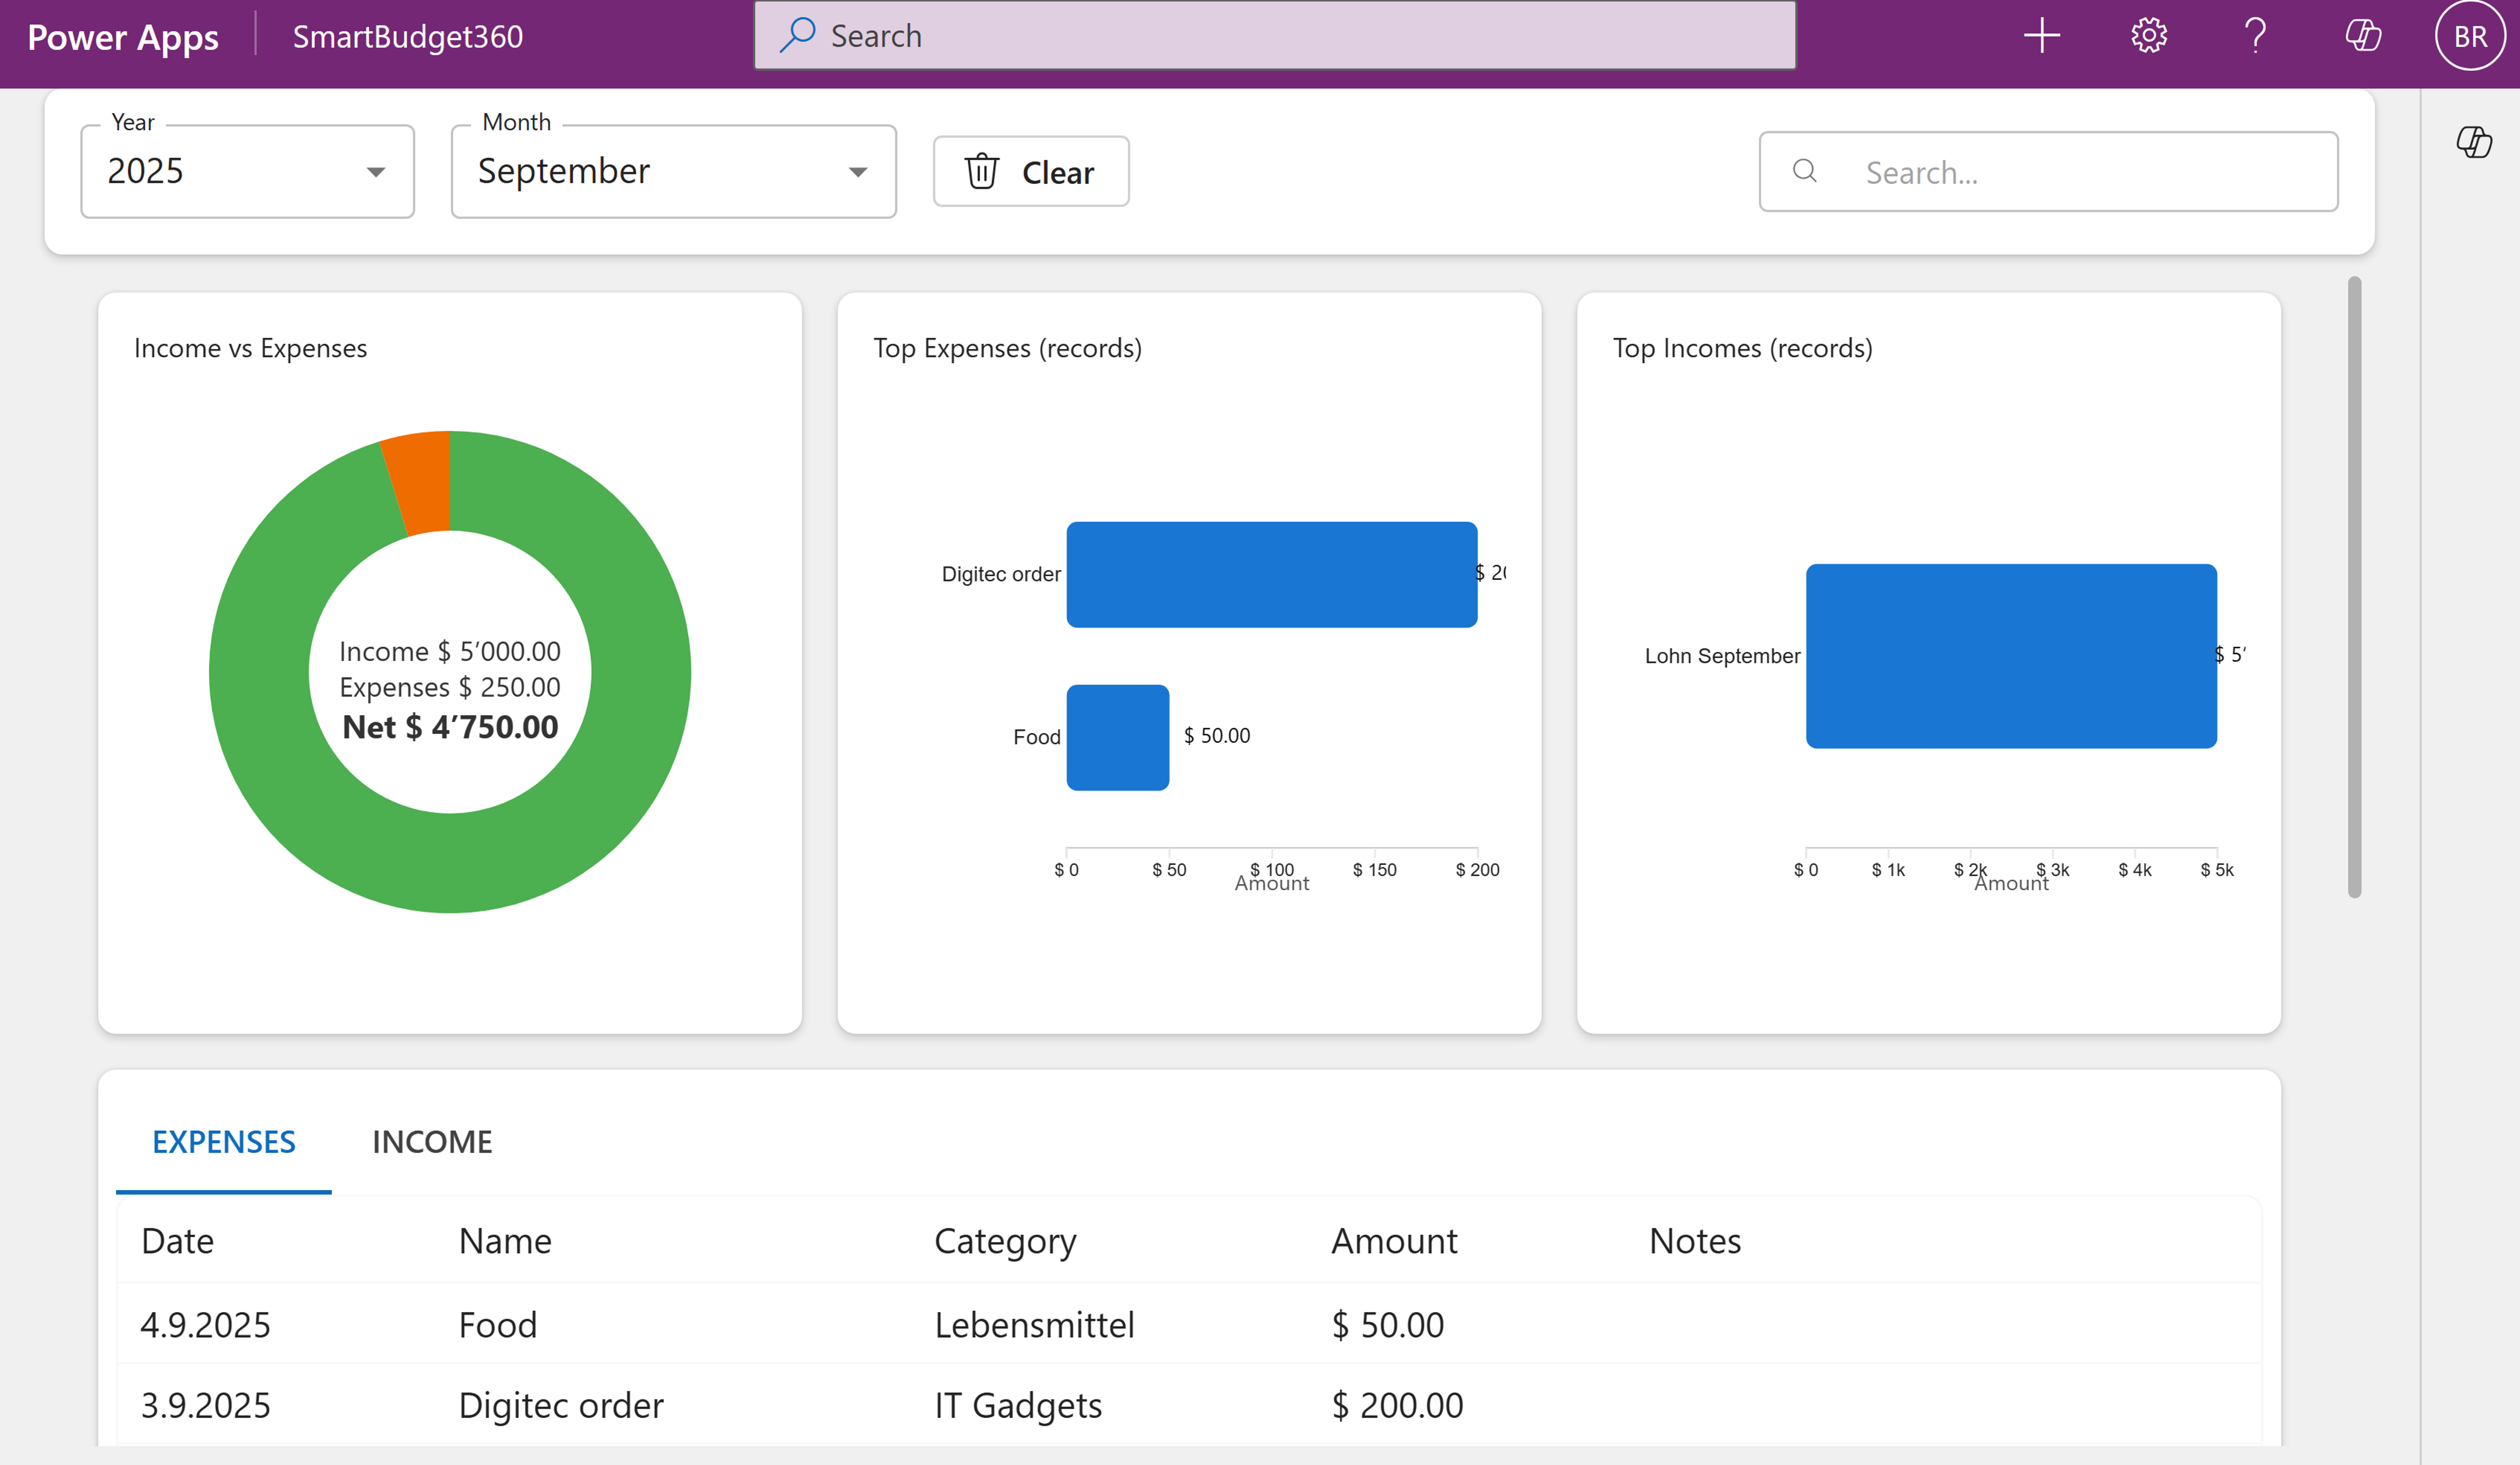
4) Final version: dark mode + UI polish
Finally, a feature I kept seeing in Generative Pages demos: a dark mode toggle. I then made a few more refinements, like tighter spacing and a dynamic table height, so "Rows per page" sits visually in the right place.
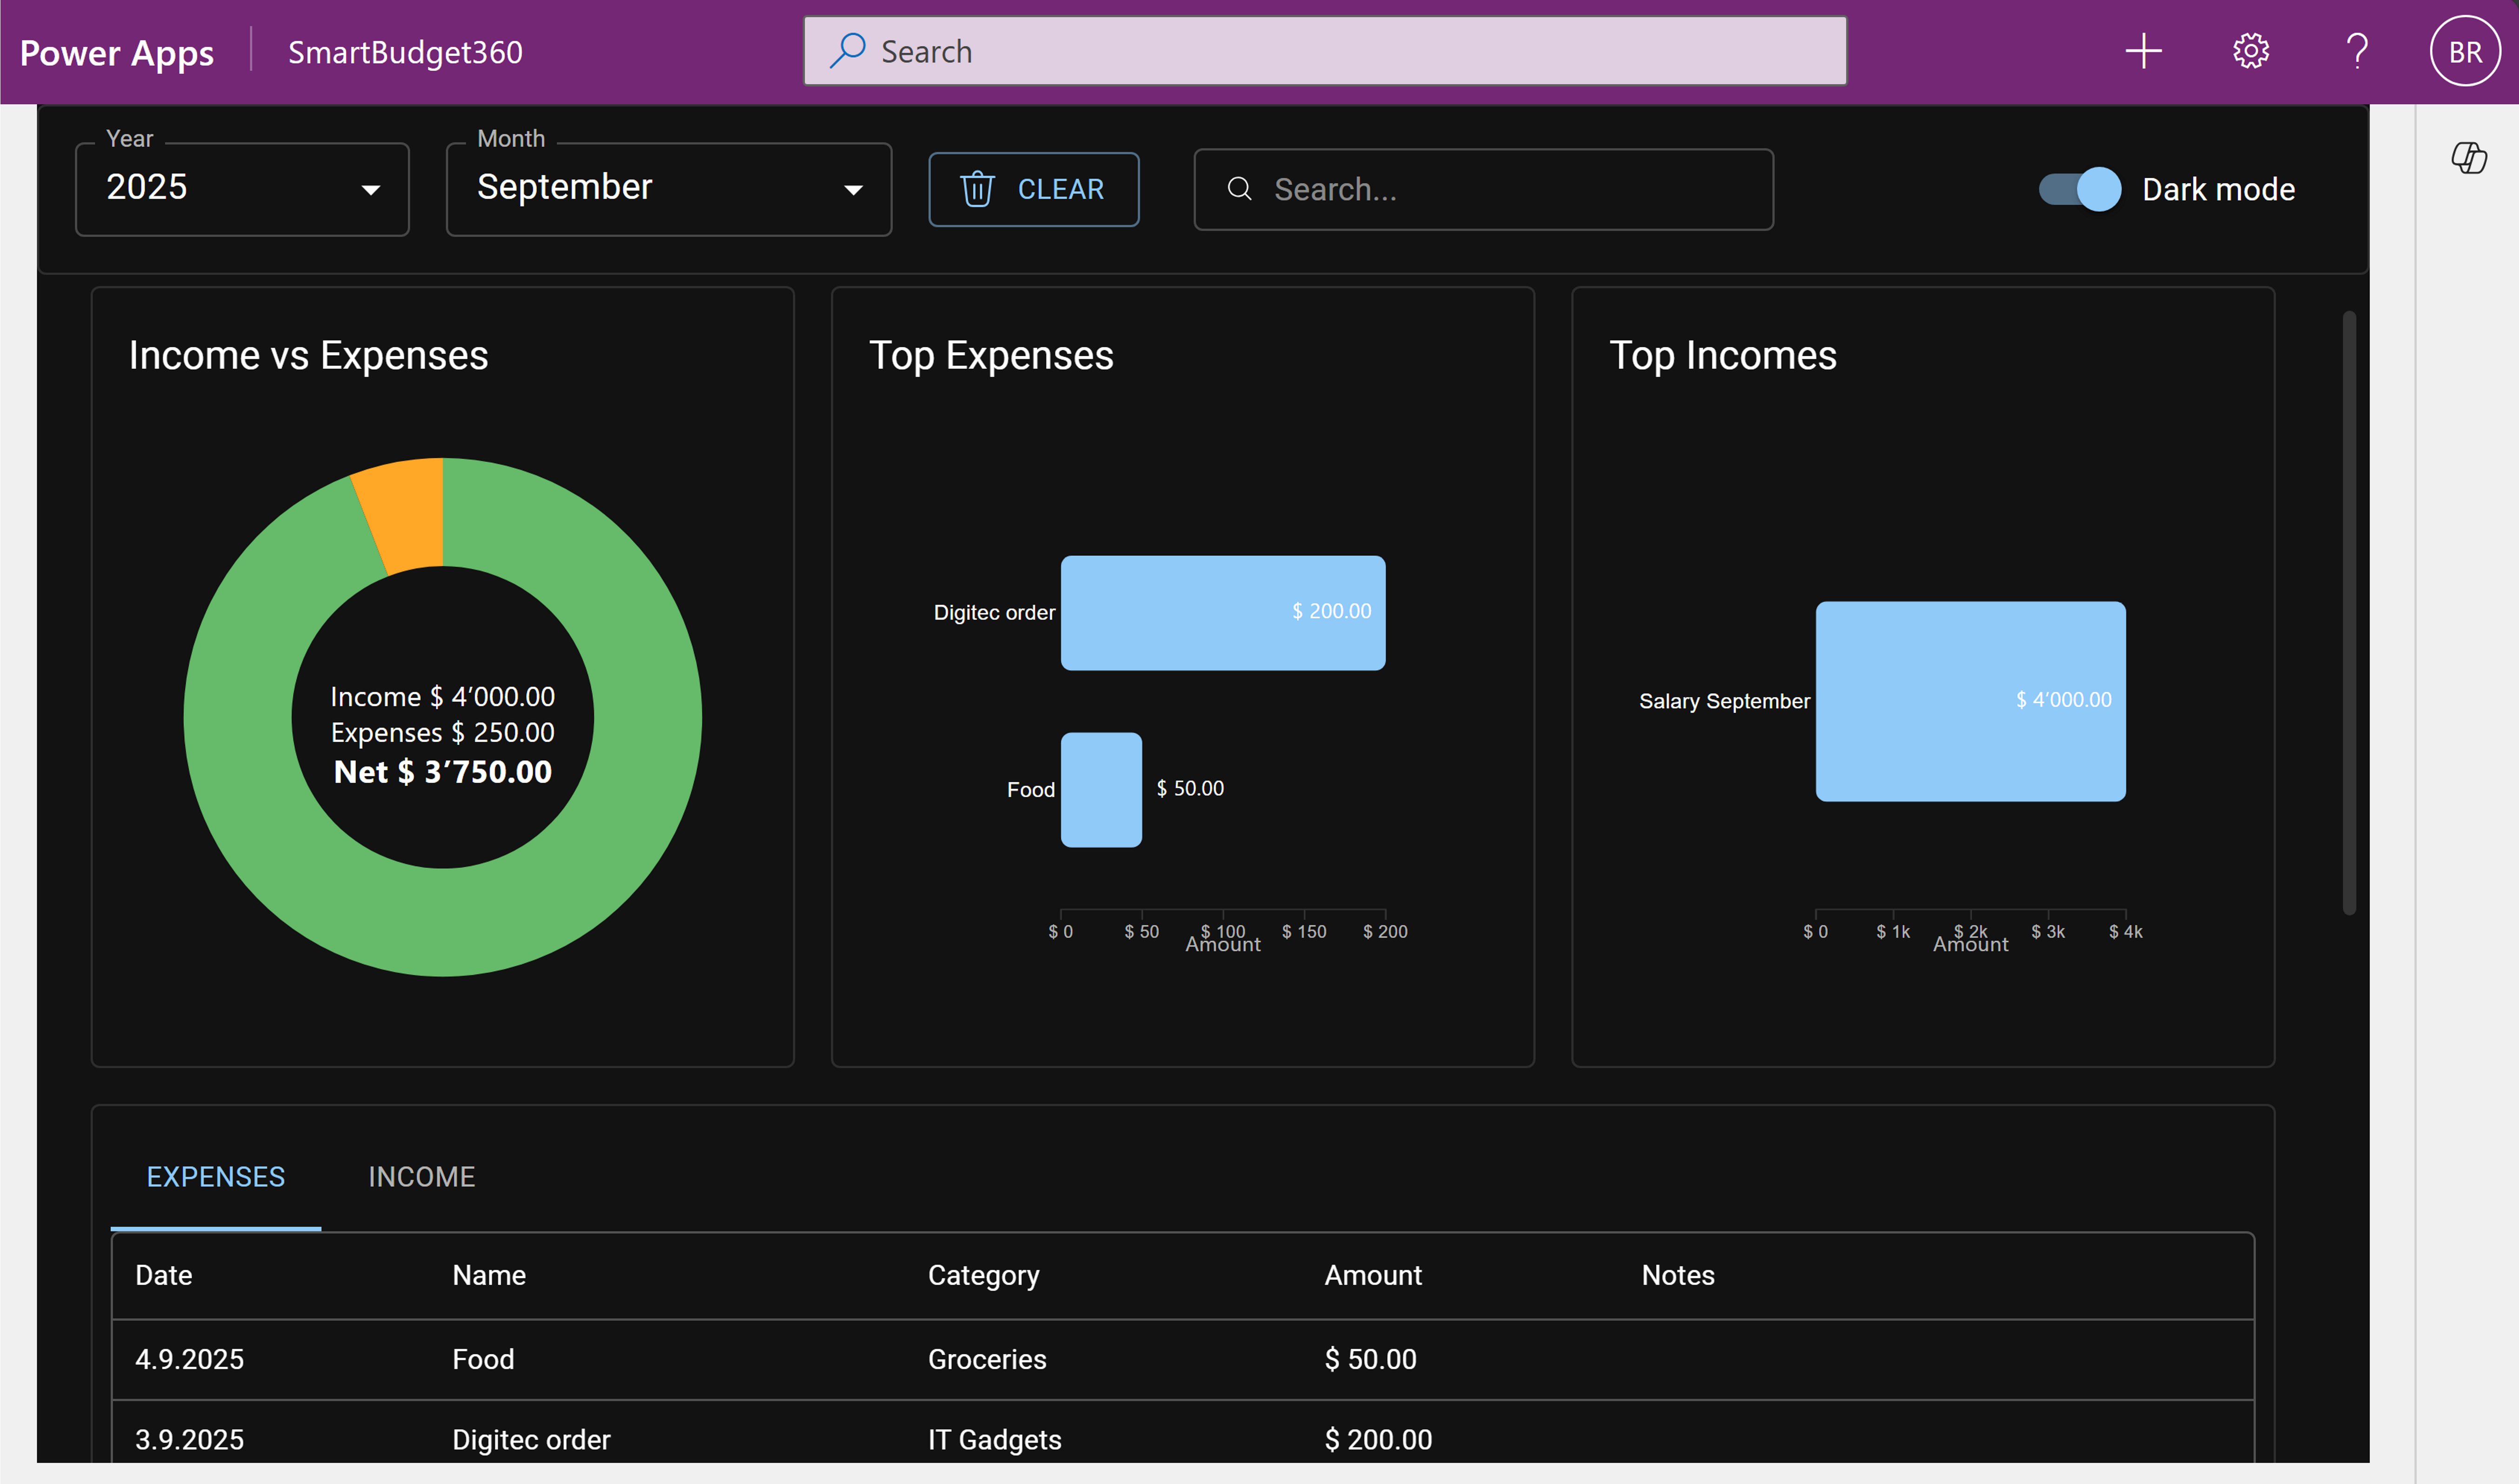
Key code building blocks
1) Date filter (OData range)
const rangeFilter = (year?: number, month?: number) => {
  if (!year) return '';
  const start = month ? new Date(year, month - 1, 1) : new Date(year, 0, 1);
  const end   = month ? new Date(year, month, 1)     : new Date(year + 1, 0, 1);
  return `br_date ge ${start.toISOString()} and br_date lt ${end.toISOString()}`;
};
2) Loading Dataverse data & formatted values
const [exp, inc] = await Promise.all([
  dataApi.queryTable('br_expenses', {
    select: ['br_expensesid','br_date','br_amount','br_notes','br_expensename','_br_category_value'],
    filter
  }),
  dataApi.queryTable('br_income', {
    select: ['br_incomeid','br_date','br_amount','br_notes','br_incomename','br_source'],
    filter
  })
]);

const expenses = exp.rows.map((r:any) => ({
  ...r,
  categoryName: r['_br_category_value@OData.Community.Display.V1.FormattedValue'] || 'Uncategorized'
}));

const income = inc.rows.map((r:any) => ({
  ...r,
  sourceName: r['br_source@OData.Community.Display.V1.FormattedValue'] ||
              (typeof r.br_source === 'string' ? r.br_source : '')
}));
3) "Income vs Expenses" donut (D3)
// Farben aus MUI-Theme
const data = [
  { label: 'Income',   value: income,   key: 'income',   color: theme.palette.success.main },
  { label: 'Expenses', value: expenses, key: 'expenses', color: theme.palette.warning.main }
].filter(d => d.value > 0);

// draw arcs … and centre text sums (Income, Expenses, Net)
4) Compact top lists (D3 bars)
- Truncate labels with an ellipsis when space is tight
- Place values directly next to the bars (no "Amount" axis title)
const trim = (s: string, n=22) => (s.length > n ? s.slice(0, n - 1) + '…' : s);

g.append('g') // y-Achse
 .call(d3.axisLeft(y).tickSize(0).tickFormat((d:any) => trim(String(d))));
5) Table: Date before Notes & search box next to tabs
const expenseCols = [
  { field: 'br_expensename', headerName: 'Name',    flex: 1.2 },
  { field: 'categoryName',   headerName: 'Category', flex: 1   },
  { field: 'br_amount',      headerName: 'Amount',   flex: 0.8, valueFormatter: p => fmtMoney(Number(p.value)) },
  { field: 'br_date',        headerName: 'Date',     flex: 0.8, valueFormatter: p => new Date(p.value as any).toLocaleDateString() },
  { field: 'br_notes',       headerName: 'Notes',    flex: 1.6 }
];
6) Placing "Rows per page" cleverly
const visibleRows = tab === 'expenses' ? filteredExpenses : filteredIncome;
const fewRows = visibleRows.length <= 6;

<DataGrid
  autoHeight={fewRows}
  rows={visibleRows}
/>
Conclusion
Generative Pages are a genuinely exciting new feature. With a good prompt from the start, you get a first draft of a page very quickly. Depending on how the prompt is structured, the result turns out better or worse. But the best part is that, with the option to extend the code, you can adapt your own page completely to your individual needs through coding. For me, it's the best example of low-code and pro-code working together.
Your Experience?
Do you have questions, or have you already experimented with Generative Pages? What were your learnings, stumbling blocks, or aha moments? I'd love to hear from you — via the contact form or on LinkedIn.

Questions or experiences of your own on this topic? I'd love to hear from you — via the contact form or on LinkedIn.